Click to view full image · Reference sample
Source
Source unavailable · Case #1
Original prompt preserved. Results vary depending on model version, reference image, and parameters; identical outputs are not guaranteed.
UI & Interfaces / PROMPT #1
Infographic Visualization Design · #1
Review the image, then copy the prompt. If placeholders are present, customize them below.
01 / Customize your version
No placeholders detected. You can freely adjust the subject, color palette, text, and aspect ratio after copying.
02 / Full Prompt · Original
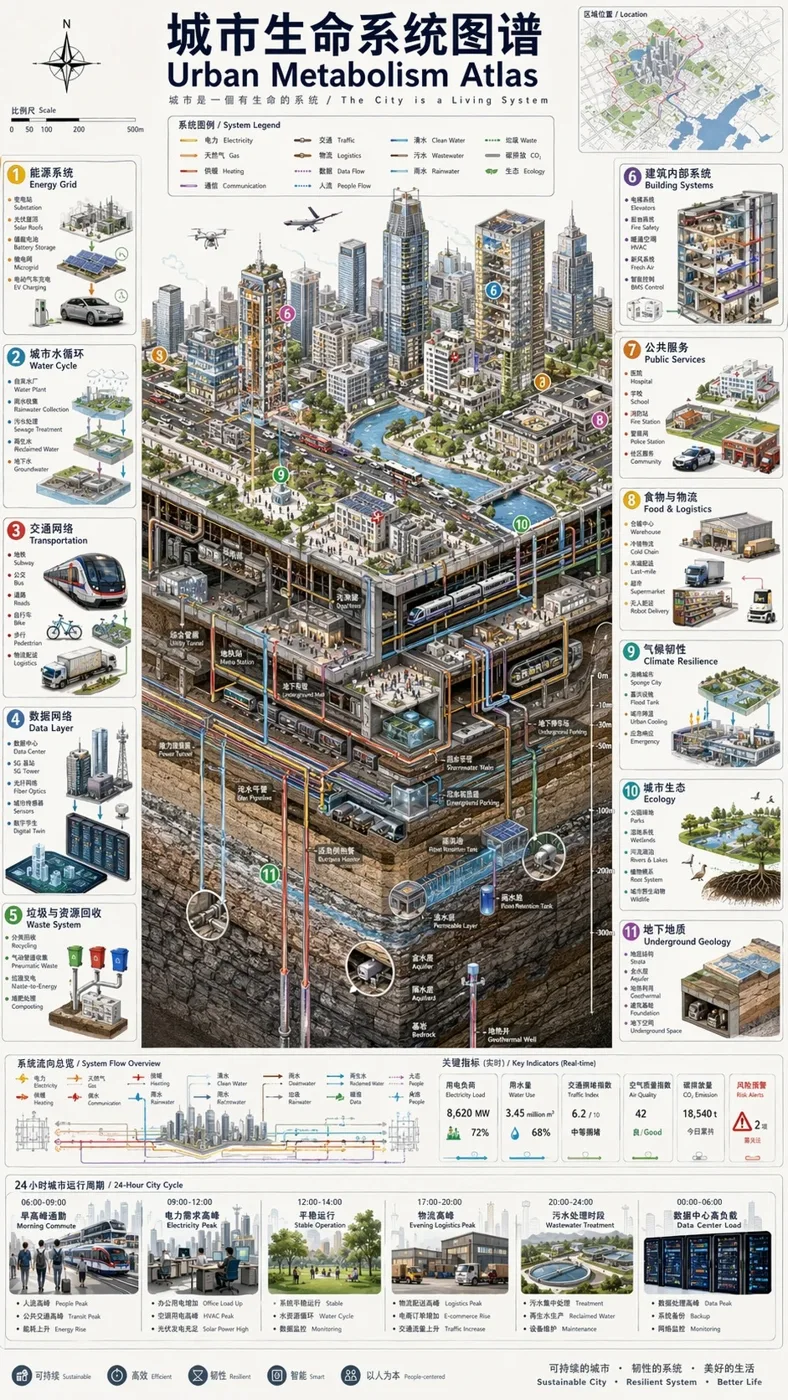
Vertical 9:16 isometric cutaway infographic "城市生命系统图谱 / Urban Metabolism Atlas". Smart city from sky to bedrock: skyscrapers, streets, subway, utility tunnels, water/sewage/gas/heating pipes, fiber, data center, flood tanks, aquifers, geothermal wells, bedrock. Color-coded flows for power/water/data/traffic/waste. 12 numbered panels bilingual CN/EN: 能源/水循环/交通/数据/垃圾/建筑/公共服务/ 物流/气候韧性/生态/地质/治理看板. 24h timeline at bottom. Style: engineering white paper + scientific atlas, light paper bg, crisp lines, 8K. No cyberpunk, no gibberish text, must show both above AND below ground.
Copy into your preferred AI image generator. Prompt Atelier provides prompt browsing and editing, but does not generate images directly.
03 / Pre-generation checklist
- Replace placeholders with specific details, and check whether reference images are needed.
- Specify exact wording for text elements, and proofread carefully after generation.
- Adjust only one element at a time—subject, lighting, or composition—to compare results easily.
Explore related inspiration
More in UI & Interfaces